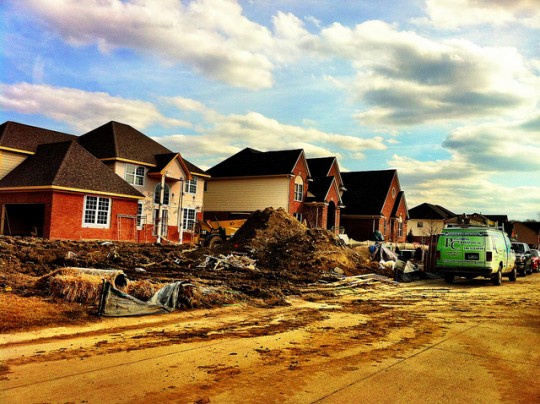
Sales of newly built single-family homes fell 14.5 percent in March from February’s rate, according to estimates released by the U.S. Census Bureau and the Department of Housing and Urban Development. The decline was more than economists expected and put new home sales 13.3 percent below last year’s level. Winter weather has been blamed for much of the sales slowdown seen throughout the early months of 2014 but, according to the report, sales fell in the West and rose in the Northeast, indicating the disappointing March numbers aren’t just due to harsh weather. Still, sales estimates for December through February have since been revised upward and the sales pace over the past year is much improved from where it was in 2011 and 2012. In short, sales of new homes – just like the overall economy and housing market – have been recovering slowly ever since the financial crisis and recent recession. Analysts expect sales to continue that recovery and pick up as the year goes on. More here.
Tag Archive for sales pace
Sales of Previously Owned Homes Slip 5.1%
Sales of previously owned homes fell 5.1 percent in January, according to estimates released by the National Association of Realtors. With the drop, last month’s sales pace was the slowest since July 2012. Lawrence Yun, NAR’s chief economist, believes unusual weather played a role in the decline. According to Yun, disruptive and prolonged winter-weather patterns across the country are impacting a wide range of economic activity and housing is no exception. Decreasing sales activity is expected to turn around, however, as the weather warms and the selling season begins this spring. Also in the report, prices continue to rise, with the median existing-home price up 10.7 percent from one year earlier. In part due to limited inventory, price increases are also being driven by a nearly 10 percent year-over-year drop in the number of distressed homes, including foreclosures and short sales, sold during the month. And though inventory has tightened, January’s estimate shows a slight increase from the month before. At the current sales pace, there was a 4.9 month supply of unsold homes available for sale at the end of January, up from 4.6 months in December. A six-month supply is considered healthy for the market and represents an equal balance of buyers and sellers. More here.
Home Sales Post Strongest Year Since 2006
In 2006 – the final year of the housing bubble – 6.48 million homes were sold. Last year, sales of previously owned homes reached 5.09 million. It was the strongest year of sales since the bubble burst and a 9.1 percent improvement on 2012’s totals, according to new data released by the National Association of Realtors. Lawrence Yun, NAR’s chief economist, said housing has experienced a healthy recovery over the past two years. Existing-home sales have risen nearly 20 percent since 2011, with job growth, record low mortgage interest rates, and a large pent-up demand driving the market, Yun said. Though housing lost some momentum in the fall, sales were up 1.0 percent in December and ended the year near normal, despite limited inventory and disappointing job growth. Total housing inventory at the end of December was down 9.3 percent to 1.86 million homes available for sale, which represents a 4.6-month supply at the current sales pace. Also in the report, the median existing-home price for all housing types was up 9.9 percent from December 2012 at $198,000. More here.
Existing Home Sales Fall 4.3 Percent In November
Sales of previously owned homes fell 4.3 percent in November, according to estimates from the National Association of Realtors. The drop slowed sales to a pace 1.2 percent below last year’s rate, marking the first time in more than two years that sales were below year-ago levels. Lawrence Yun, NAR’s chief economist, said the market is being squeezed by constrained inventory. According to Yun, there is pent-up demand for owner-occupied housing and, though household formation will inevitably burst out, limited supply is slowing the sales pace. It’s also driving price increases. The national median existing-home price for all housing types was $196,300 in November, up 9.4 percent from last year. Median prices are highest in the West, where the median sales price was $284,400. The Midwest had the lowest median price at $151,100. More here.
Existing Home Sales Slip In October
According to the National Association of Realtors, sales of previously owned homes fell 3.2 percent in October. The drop marks the second consecutive month of slowed sales numbers. Lawrence Yun, NAR’s chief economist, said a flattening trend is expected. According to Yun, low inventory is holding back sales while, at the same time, pushing home prices up. And though inventory fell just 1.8 percent from the month before, the national median existing-home price was $199,500 in October, up 12.8 percent from last year. There have now been eleven consecutive months of double-digit year-over-year increases in median home price. Still, home sales were up from last year in the Midwest, South, and Northeast. The West, where constrained inventory has held back the sales pace, was flat as compared to one year ago. More here.
September Existing Home Sales Slide 1.9%
During the summer selling season, sales of previously owned homes reached the highest level in nearly four years. But, according to estimates from the National Association of Realtors, sales of existing homes fell 1.9 percent in September. Lawrence Yun, NAR’s chief economist, said the decline was expected. Affordability levels have fallen as home price increases have easily outpaced income growth, Yun said. Still, sales are 10.7 percent above year-ago levels and have been better than the year before for the past 27 consecutive months. Also in the report, the median time on market for all homes was 50 days, up from 43 days in August but far better than last year’s 70 day median. Total housing inventory was virtually unchanged, with a 5-month supply of homes available at the current sales pace. More here and here.
