Rising home prices are often seen as a sign that the housing market is healthy and doing well. But, according to Trulia’s latest Price and Rent Monitor, just because an area is experiencing sharp price increases doesn’t mean it’s fully recovered. For example, the five metropolitan areas that have seen the largest price gains over the past year, are all significantly below normal levels when looking at construction activity and building permits. On the other hand, metro areas that didn’t suffer large price declines during the recession – and, therefore, have had relatively small price increases since – are experiencing a residential construction boom. The takeaway, according to Trulia’s chief economist Jed Kolko, is that the housing recovery is going to require more than just increasing home values before it’s truly rebounded from the financial crisis. While the overall trend is positive, the particulars of each local market require a deeper look. Also in the report, home prices experienced their smallest year-over-year increase in 11 months, though they’re up 2.8 percent quarter-over-quarter. More here.
Tag Archive for metropolitan areas
Rent Vs. Buy: Why Buying Is A Better Deal
New research shows the costs associated with buying and owning a home are less expensive than monthly rent after just two years living in a house. The study, from Zillow’s economics team, looked at a comprehensive list of costs and benefits for both buying and renting a home, including a 20 percent down payment, property tax, owner’s insurance, maintenance, rent payments and rental insurance. The results found buying a home to be a better deal in half of the nation’s metropolitan areas. This is due primarily to the fact that rent has been rising across the country and, despite recent increases in home prices and mortgage rates, buying a house remains very affordable based on historical averages. Among the factors to watch in order to determine whether it’s more costly to buy or rent, home values are one of the most significant. The faster home prices rise, the quicker a homeowner’s equity will offset the costs of owning a home. On the other hand, as rental costs increase, the cost of renting becomes more expensive than buying that much quicker. More here.
City Vs. Suburb: Where Prices Are Rising Fastest
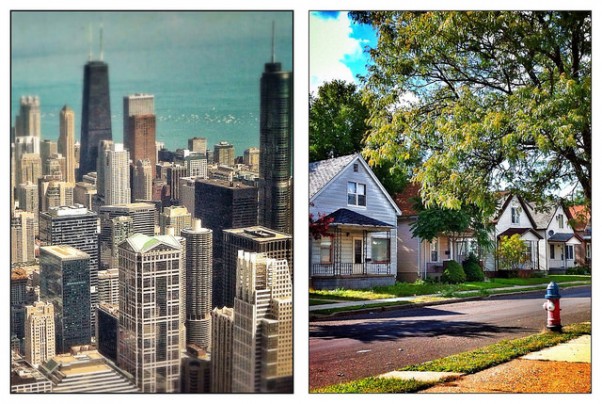
Despite more homes being put up for sale in anticipation of the spring home buying season, asking prices are up from last year in 97 of 100 metropolitan areas tracked by Trulia’s Price Monitor. Typically, more homes on the market keeps prices from increasing but, because this spring is expected to be a good one for housing, prices have continued to rise. In fact, asking prices are up 10 percent nationally over the past year and climbed 1.2 percent in March from February’s level. The report also found that price per square foot increased more in cities than in suburban neighborhoods. High-density, urban neighborhoods experienced price increases of 9.8 percent since last year, while homes in the suburbs saw prices rise 9.4 percent. Still, population growth in suburban neighborhoods was stronger than city neighborhoods over the past year. According to the report, this is true because – though more people moved to the suburbs – there is more room for new construction in suburban areas and the ability to create more inventory to meet buyer demand helps moderate price gains. More here.
Prices Rise In 97 Of 100 Largest Metro Areas
Trulia’s Price Monitor is the earliest leading indicator of where asking prices are headed on both a national and local basis. The Monitor can detect price trends at least three months in advance of the major sales-price indexes. According to the most recent release, asking prices were up 11.4 percent in January as compared to one year earlier. In fact, of the 100 largest metropolitan areas, 97 saw asking-price increases from January 2013. Prices were also up on a quarterly and monthly basis. The results show a 1.1 percent price increase from December, which is the strongest one-month gain since June 2013. There was also a 2.1 percent improvement in prices on a quarterly basis. However, quarterly increases remain below spring 2013’s rate, when prices accelerated at the fastest pace since the housing crash. Overall, home prices have risen most in the areas that experienced the largest declines during the most recent recession. More here.
Price Gains Cool Down In Hottest Markets
Trulia’s Price Monitor gauges home price trends based on asking prices, which means the Monitor is among the earliest indicators of where home values are headed mostly due to the fact that asking prices lead sales prices by approximately two months. In November, asking prices were up 1 percent month-over-month and 3 percent quarter-over-quarter. Prices are now 12.1 percent above last year and have risen in all but two of the largest metros over the past 12 months. Despite the increases, however, home price gains are beginning to slow after spiking earlier this year. The slowdown is most pronounced in metropolitan areas that experienced the largest price increases in the first half of 2013. On the other hand, in the 56 markets where prices rose by less than 10 percent year-over-year, price gains actually accelerated in the most recent quarter. More here.
Report Finds More Evidence of Cooling Price Increases
Home prices rose rapidly through the first half of the year, signaling a rebound and a healthier housing market. But now there is increasing evidence that home prices may be cooling off. According to Trulia’s Price Monitor, asking prices were up 3 percent quarter-over-quarter in September, the smallest gain since February. Jed Kolko, Trulia’s chief economist, said asking prices are the first indicator of where home sale prices are headed and they point to a slowdown. According to Kolko, two thirds of the largest metropolitan areas are experiencing cooling prices and 11 of the 100 largest cities are actually seeing prices begin to slip. Rising mortgage rates, expanding inventory, and less investor activity are among the reasons for the slowing price increases, Kolko said. Year-over-year, home prices were up 11.5 percent, but that number is expected to shrink in coming months. More here.

Number of Improving Housing Markets Hits Record High
The number of improving housing markets across the country has reached a record high, according to the National Association of Home Builders’ Improving Markets Index. The index determines improvement based on each metropolitan areas’ low point in housing permits, employment, and house prices. They are added to the index after showing six consecutive months of improvement in all three categories. September’s results found 291 metro areas that qualified as improving housing markets, up 44 from August. Rick Judson, NAHB’s chairman, said over 80 percent of the 361 metros tracked by the index are showing consistent growth, which is an excellent indicator of how the housing recovery has begun to take hold across the country. More here.


