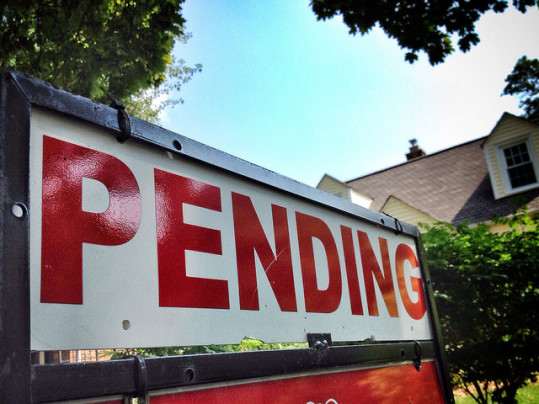
Trying to gauge the health of the real estate market can be confusing to the average home buyer or seller. After all, there’s a seemingly endless supply of data, reports, and surveys and all of them measure a different aspect of the housing industry – whether it’s home sales, housing starts, or prices. However, when the vast majority show improvement, it’s likely that things are headed in the right direction. The latest positive indicator is the National Association of Realtors’ Pending Home Sales Index. The index – which measures the number of contracts to buy homes signed during the month – rose for the fifth straight month and reached its highest level in nine years. Lawrence Yun, NAR’s chief economist, says May’s results increase the likelihood that home sales are off to their best year since the downturn. “The steady pace of solid job creation seen now for over a year has given the housing market a boost this spring,” Yun said. “It’s very encouraging to now see a broad based recovery with all four major regions showing solid gains from a year ago and new home sales also coming alive.” More here.
Archive for June 2015
New Home Sales Continue To Climb
Recent housing data has given potential home buyers and sellers plenty of reason to feel encouraged, with many industry analysts forecasting a good summer season following strong spring gains. Now, according to new estimates from the U.S. Census Bureau and the Department of Housing and Urban Development, sales of newly built, single-family homes have added to the optimistic news. In fact, new home sales beat economists’ expectations in May, rising 2.2 percent above April’s revised rate and 19.5 percent above last year. The improvement brought new home sales to their highest level since February 2008. Combined with the recent spike in sales of previously owned homes, the data is another sign that the housing market’s rebound is gaining ground. Also in the report, the median sales price of new homes sold in May was $282,800; the average sales price was $337,000. At the current sales pace, there was a 4.5-month supply of new homes for sale at the end of the month. Typically, a six-month supply is considered a healthy market. More here.
Existing Home Sales Hit 6-Year High
Sales of previously owned homes rose 5.1 percent in May and are now 9.2 percent higher than they were one year ago, according to new estimates released by the National Association of Realtors. Lawrence Yun, NAR’s chief economist, says home sales are now at their highest pace since November 2009. “Solid sales gains were seen throughout the country in May as more homeowners listed their home for sale and therefore provided greater choices for buyers,” Yun said. In fact, the total number of homes available for sale across the country increased 3.2 percent in May, which should help moderate price increases in addition to providing better opportunities for buyers. Among those buyers, first timers represented an ever larger share in May, accounting for 32 percent of home sales. One year ago, they were just 27 percent of sales. Yun says the return of first-time buyers is an encouraging sign and the result of strong job gains, less expensive mortgage insurance, and low down payment programs. Regionally, the Northeast led with an 11.3 percent improvement over the month before, though the Midwest, South, and West all saw gains in May. More here.
Mortgage Rates Fall After Consecutive Increases
According to the Mortgage Bankers Association’s Weekly Application’s Survey, average mortgage rates fell last week after rising the previous two weeks. Mortgage rates were down across all loan categories, including 30-year fixed-rate loans with both conforming and jumbo balances, loans backed by the Federal Housing Administration, and 15-year fixed-rate loans. The drop in rates led to a slight increase in both purchase and refinance activity. In fact, refinance activity gained 2 percent from the previous week and purchase demand was up 1 percent. On an unadjusted basis, demand for loans to buy homes is now 18 percent higher than it was one year ago. Michael Fratantoni, MBA’s chief economist, told CNBC that the 18 percent year-over-year gain in purchase application volume is yet another sign of growing strength in the housing market. Combined with recent increases in home sales and permits to build new homes, the news is a welcome sign that residential real estate is benefiting from rebounding consumer confidence and an improved labor market. The MBA’s weekly survey has been conducted since 1990 and covers 75 percent of all retail residential mortgages. More here.
Housing Forecast Sees Bright Days Ahead
After a weaker-than-expected first quarter, economic activity has picked up and should accelerate even more through the end of the year, according to the latest forecast from Fannie Mae’s Economic & Strategic Research Group. The latest forecast from the group – which releases an updated economic and housing outlook each month – sees continued improvement ahead due to strengthening employment conditions and gains in household income. Doug Duncan, Fannie Mae’s chief economist, says the acceleration in income growth combined with declining gas prices should also help boost consumer spending. As for the housing market, Duncan expects the improvements seen at the beginning of this quarter to continue. “Our forecast for housing and mortgage activity remains unchanged amid continued improvement seen at the start of the second quarter,” Duncan said. “We expect total housing starts and total home sales in 2015 to rise about 10 and 5 percent, respectively, with mortgage originations increasing approximately 23 percent to $1.46 trillion. Given the uneven economic growth in the U.S. and slow growth around the globe, interest rates are unlikely to surge. This should enable the housing market to better withstand some headwinds from higher rates this year than in years past.” More here.
Foot Traffic Signals Strong Summer Sales
Every month, the National Association of Realtors measures home buyer interest by tracking the number of times lock boxes are opened at for-sale properties. Known as foot traffic, the number of interested buyers looking at homes for sale is a good indicator of future home sales and overall demand for real estate. In May, foot traffic rose for the sixth consecutive month and improved year-over-year in all but four of the included metro areas. The index – which scores results on a scale where any number above 50 means more than half of the included markets had stronger foot traffic than the month before – registered a 59 in May, 13.8 points higher than one year earlier. The consistent gains indicate that, despite higher home prices and rising mortgage rates, Americans’ interest in buying homes has not suffered. In fact, even in markets where foot traffic was slower than last year, all but one showed an improvement from last month’s year-over-year measure. Overall, it is an indication that the spring selling season has been stronger than last year’s and the trend should continue through the summer. It’s also a positive sign that better economic conditions and an improved labor market will likely balance out the effects of possible mortgage rate increases over the coming months. More here.
Why You Have To Pay Attention To Property Tax
There are a lot of things to consider when buying a home and many of them have to do with costs. For first-timers and even some move-up home buyers, calculating mortgage rates, closing costs, a down payment, and the eventual monthly mortgage payment can be overwhelming. So much so that it’s easy to forget a few things along the way. One of those easily forgotten things is property tax. When looking at the price of homes in a particular neighborhood, don’t forget to have a look at what they pay in taxes per year. Property tax varies from one area to the next and, depending on where you’re looking, can add a significant amount to your bottom line. For example, a recent analysis from RealtyTrac, which looked at data from the nation’s Metropolitan Statistical Areas, revealed that the highest average property taxes were found in the urban centers of New York, northern New Jersey, and eastern Pennsylvania, with communities paying as much as $12,923 a year in taxes. On the other end of the spectrum, homeowners in Fort Smith, Arkansas and portions of Oklahoma paid an annual bill of less than $500 a year. With that in mind, have a look at what taxes have been over the past few years, in the neighborhoods where you’d most like to buy, to get a feel for what it adds to the total cost of buying a house. More here.


