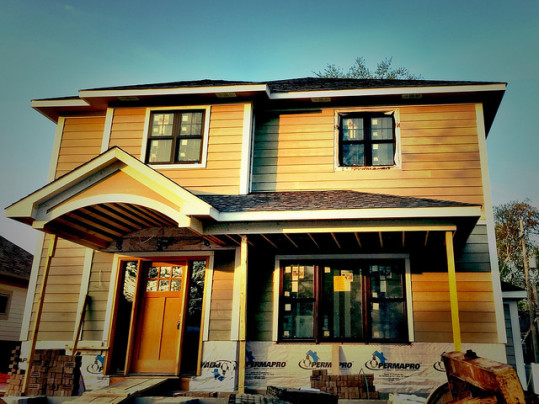
Because builders have an unique perspective on the market for new homes, the National Association of Home Builders tracks their outlook on current buyer traffic, sales conditions, and future sales expectations as part of their monthly Housing Market Index. The index measures builder confidence on a scale where any number above 50 indicates more builders view conditions as good than poor. In May, the index dropped two points to 54. Despite the decline, however, the index remains above 50 and is now nine points higher than it was at the same time last year. David Crowe, NAHB’s chief economist, says potential home buyers are feeling cautious and want to be more stable financially before purchasing a house. “On the bright side, the HMI component measuring future sales expectations has been tracking upward all year, mortgage rates remain low, and house prices are affordable,” Crowe said. “These factors should spur the release of pent-up demand moving forward.” In fact, though the components measuring current conditions fell slightly, sales expectations for the next six months increased one point to 64, matching the generally optimistic forecasts of many industry experts and economists. More here.
Archive for May 2015
Applications To Buy New Homes Up In April
New data from the Mortgage Bankers Association shows the number of mortgage applications for new home purchases increased 0.3 percent in April from the month before. Though relatively flat month-over-month, Mike Fratantoni, MBA’s chief economist, says the spring season got off to an earlier than usual start this year. “Applications were essentially flat in April, but March and April builder applications were at their highest levels since we began tracking them in August 2012. On a year-over-year basis, applications to builders for new home mortgages were up 16 percent,” Fratantoni said. “Although our survey indicates there was likely a slight decrease in new home sales in April, we had seen increased activity earlier in the year, so borrowers who were able to enter the market got a head start on the traditional spring buying season.” By type of loan, conventional mortgages made up the largest share of applications, totaling a full 67 percent of all applications. Also, the average loan size of new homes reached its highest level in survey history, increasing from $314,394 in March to $315,670 in April. More here.
Gov’t Housing Report Finds Encouraging Signs
Each month, the U.S. Department of Housing and Urban Development and the U.S. Treasury release a report collecting key housing market data and the results of the federal government’s foreclosure prevention efforts. The Housing Scorecard is a measure of how far the residential real estate market has rebounded since the housing crash and financial crisis. According to the most recent report, there are many reasons for optimism. For example, sales of previously owned homes reached their highest level since September 2013 in March and, though new home sales fell after reaching a 7-year high in February, they are still 19.4 percent higher than they were a year earlier. Home prices have also shown signs of further stabilization and are now approximately where they were in January 2006. Overall, the scorecard paints an encouraging picture, though it cautions that there is still work to be done to help foster home sales, help homeowners that remain underwater, and reduce mortgage delinquency rates. It also notes that there are considerable geographic variations in market conditions. More here.
Mortgage Credit Availability Increases
According to the Mortgage Bankers Association, mortgage credit availability is on the rise, making it easier for prospective home buyers to qualify for a loan to buy a home. The Mortgage Credit Availability Index measures whether lending standards are loosening or tightening. When lending standards are tighter, it means otherwise qualified buyers may not be able to obtain a loan because of strict requirements. When those standards loosen, more prospective borrowers will be approved for loans. In April, the index increased 0.5 percent. Mike Fratantoni, MBA’s chief economist, said the increase was due to new loan products becoming available. “The increase was driven by new offerings of FHA’s 203K home improvement program, new VA offerings, and new jumbo products,” Fratantoni said. “The increase was partially offset by some investors tightening underwriting criteria on conventional cash out offerings.” Of the individual index components, government loans saw the greatest increase in credit availability, rising 1.1 percent from the previous month. More here.
Housing Market Recovery Spreads To More Metros
The housing market’s recovery has been gradual and, at times, volatile. But, according to the National Association of Home Builders Leading Markets Index, the number of local markets that are at or above 90 percent of their previous normal level has hit 157, which is nearly half of the 360 metro areas included in the index. The index – which compares each market’s permit, price, and employment levels to their last normal period – also shows a full 68 percent of markets have improved from last year. Most of those improvements have come due to a significant improvement in employment conditions across the country. “The markets are continuing to make gains,” said NAHB chairman Tom Woods. “A strengthening economy and low interest rates should spur the release of pent-up demand and keep housing moving forward this year.” Some of the markets that have experienced the most improvement include Baton Rouge, Austin, Honolulu, Houston, San Jose, Los Angeles, and Nashville. Among smaller markets, metros in Kansas, North Dakota, and Texas lead the list. More here.
Home Prices Accelerate In Markets With Low Inventory
A new report from the National Association of Realtors found that home prices increased at a faster rate during the first quarter of this year than they did at the end of last year. In fact, 51 metro areas saw double-digit increases during the first three months of the year, which is significantly higher than the 24 cities that saw double-digit gains at the end of last year. Lawrence Yun, NAR’s chief economist, said after moderating at the end of 2014, home prices have accelerated in several metro areas. “Sales activity to start the year was notably higher than a year ago, as steady hiring and low interest rates encouraged more buyers to enter the market,” Yun said. “However, stronger demand without increasing supply led to faster price growth in many markets.” In short, markets where there are a lot of buyers but a lower than normal amount of homes available for sale will experience more price increases than in markets where there are enough homes for sale to meet demand. Also in the report, the national median existing single-family home price in the first quarter was $205,200, which is a 7.4 percent increase from the same period last year when the median price was $191,100. More here.
New Home Market Solid Among Older Buyers
A recent survey of builders conducted by the National Association of Home Builders shows the market for new homes among buyers age 55 and older has now experienced four consecutive quarters in positive territory. The survey – which asks builders to rank current sales, prospective buyer traffic, and sales expectations for the next six months – scores their answers on a scale where any number above 50 indicates more builders view conditions as good than poor. According to results for the first quarter of 2015, the market for new single-family homes is solidly in positive territory at 58. In fact, the component measuring present sales increased one point to 64 and the gauge of sales expectations for the next six months rose three points to 67. Timothy McCarthy, chairman of NAHB’s 50+ Housing Council, said builders remain optimistic about the outlook through the end of the year. “Builders in many parts of the country were affected by a particularly severe winter, but builders and developers in the 55+ sector continue to be positive as we move forward in 2015,” McCarthy said. “The weather had an effect on traffic, and moderated and delayed settlement schedules. Nonetheless, 55+ builders’ confidence remains bullish on the outlook for the balance of the year.” More here.


